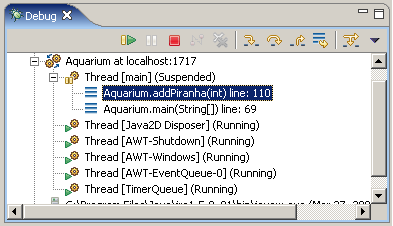
The Debug pane allows you to inspect your method call stack as your code is executing. Each time a method is called, an entry for the method is placed at the top of the call stack. Once the method is finished executing, the method returns, and the entry for the method is removed from the call stack.
main() method at the call to the addPiranha() method.Click the  button to enter the
 addPiranha() method.
The method in the call stack that is currently being executed is highlighted. As each line of code in the highlighted method is executed the line information asssociated with the method is updated appropriately.
By inspecting the Debug pane you can see
that the addPiranha() method of the Aquarium class
is the currently executing method and that it was called by the main()
method of the Aquarium class.

In more complicated examples than this tutorial, the call stack can help you understand the complicated way in which methods call each other. It also gives you a convenient way to look at variables local to each method in the stack. Click on the method's entry in the Debug pane, and the Variables pane will switch to display the variables of that method.
Click on the entry for Aquarium.main() to look at the
variables currently visible in this method.

You can use the Debug pane to view the source code in the Text pane as well. Double click on a method entry in the call stack, and the corresponding source code will be displayed in the text pane.
Now click the  button to complete the execution of the
 addPiranha() method.
The addPiranha() method returns and its entry gets removed from the call stack.
The main() method is highlighted, indicating that it is the currently executing method,
and the line number information has been updated, indicating that this is the next line of code that will be executed.
Provide me with screenshot of your environment now!
