Once the desired breakpoints have been set, it is time to run the debugger program.
To start the debugger program, press the  button.
It is located just above the Debug pane.
Once started, the debugger will execute your program normally until it reaches a line of code that contains a breakpoint or the program terminates. When it reaches a line with a breakpoint, it will stop and it will not execute the line with the breakpoint.
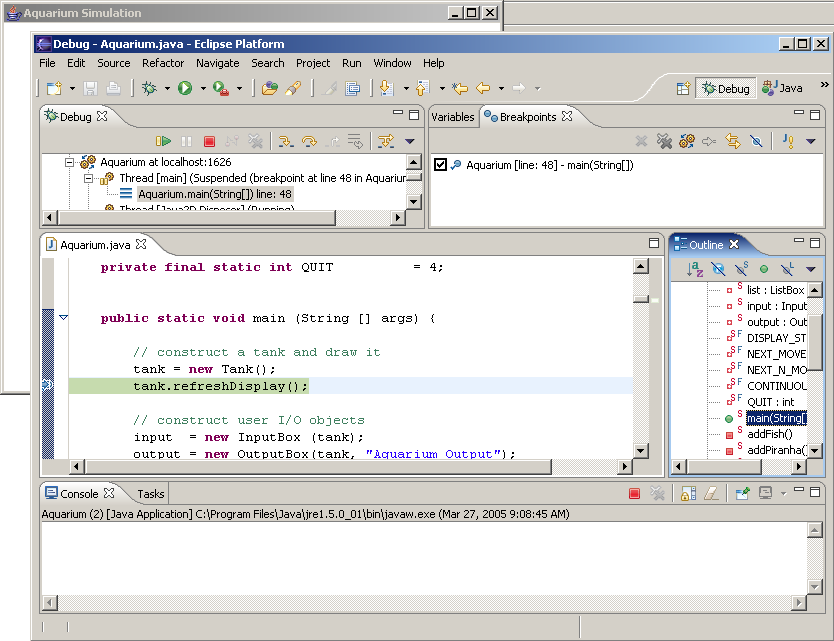
If a breakpoint was set as directed in the previous tutorial step, the breakpoint will be encountered fairly quickly. When execution stops, your debug window should look similar to this image.

The line that you set the breakpoint at is highlighted. Execution of your code has stopped just before that line.
You should expect to see some activity in the Debug pane as the code is executing.
An entry for Aquarium.main() is highlighted.
This indicates that the code that is being executed is in that method.
Sometimes the debugger can get caught in an infinite loop.
If it does, it will never reach your breakpoint to stop execution.
In this case, you can click the  button to halt execution immediately.
You can switch back and forth between the regular Java perspective
and the Debug perspective whenever it is convenient.
You can use the menu, or use the perspective switching buttons
 in the upper right
corner of your window.
![]() Provide me with a screenshot of your environment at this time.
Provide me with a screenshot of your environment at this time.