The Debug perspective is a collection of panes that is particularly useful when debugging programs. Programs may run considerably slower in debug mode than in normal mode, especially when window graphics and text must be updated. Be patient!
| 1. Switch to the Debug perspective. | 
|
|---|---|
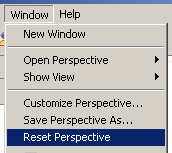
| 2. Reset the perspective to its defaults. | 
|
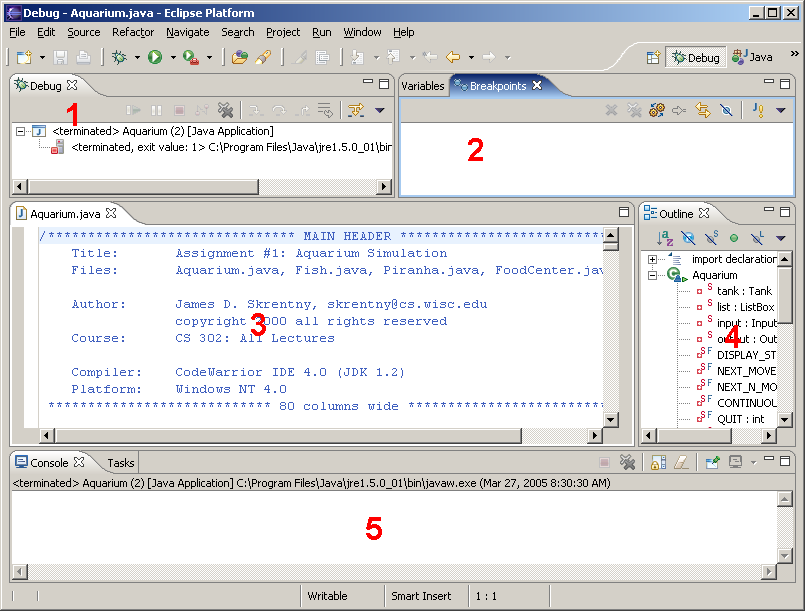
The Debug perspective consists of several panes. Each of the five main areas of this perspective are described below.
If the Aquarium.java file is not showing as seen in the image below:

Aquarium.java file.

This pane keeps a record of the results of each session you have terminated. If you ran the simulation before opening the debug perspective, there will be an entry. An exit value of 0, means that program ended normally. It is a good idea to clear this pane regularly to reduce clutter on your screen.
To remove all terminated debugging sessions,
press the  button
in the Debug pane.
Only variables that are currently accessible are shown here.
A breakpoint is just a marker. You add such a marker to various lines of your program's source code. When the debugger reaches such a marker, it stops executing the program and waits for the next instruction from whomever is running the debugger (you).
These panes will be discussed in more detail later. Click on the label of either pane to view the pane.
You have seen a similar view in the Java perspective. However, this view is somewhat different. The shaded bar on the left is used to set breakpoints.