For your first programming project, you are to demonstrate that the estimate of area under a curve improves as you increase the number of rectangles (decrease the interval width, which is equivalent to increase the the number of intervals).
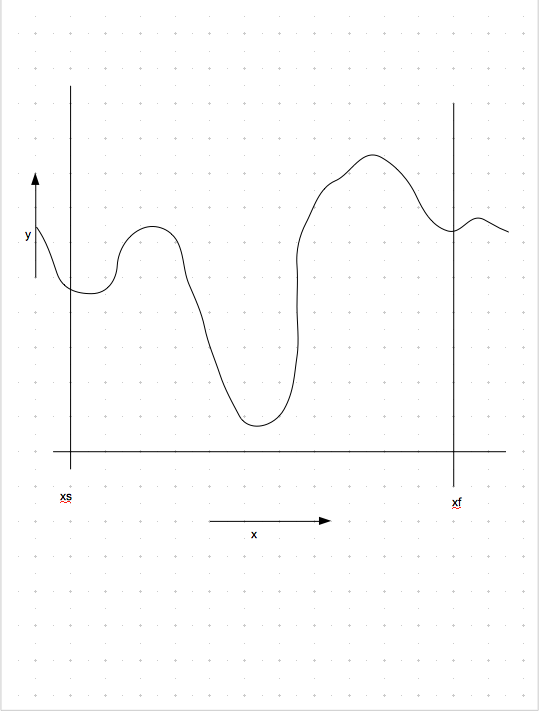
This first figure shows the curve we wish to integrate from x = xs to x = xf. The curve is given by f(x).
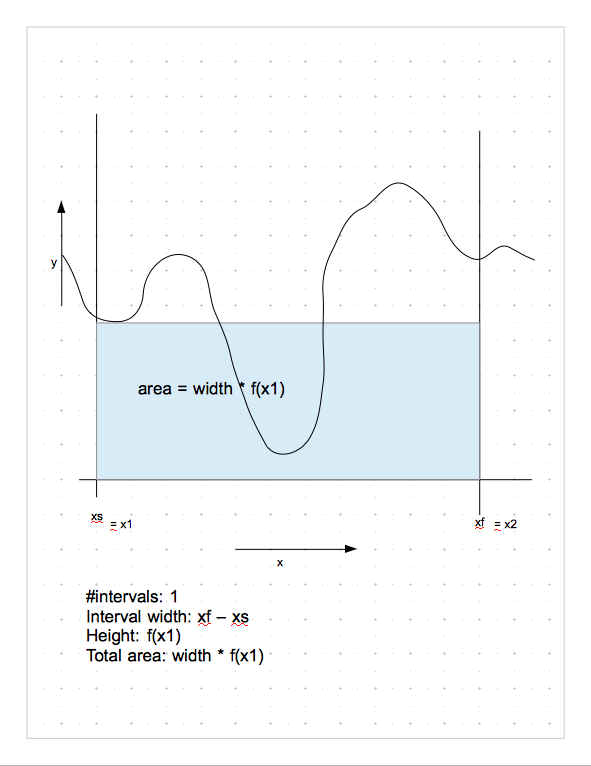
The second figure shows the range of x "divided" into one segment with width = xf - xs. This first estimate of area under the curve is given by the area of the rectangle with width = xf - xs, and height given by f(xs).
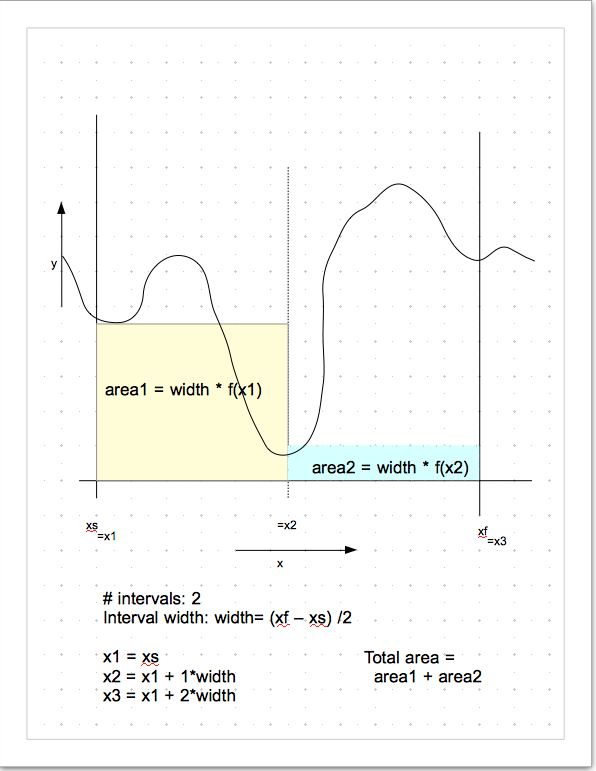
The third figure shows the range of x divided into two segments. The width of each segment is the same, and the figure shows how to calculate the width. After calculating the width, it is easy to calculate each value for xi. In this case, there are two rectangles, and the area under the curve is estimated by summing the areas of the two rectangles.
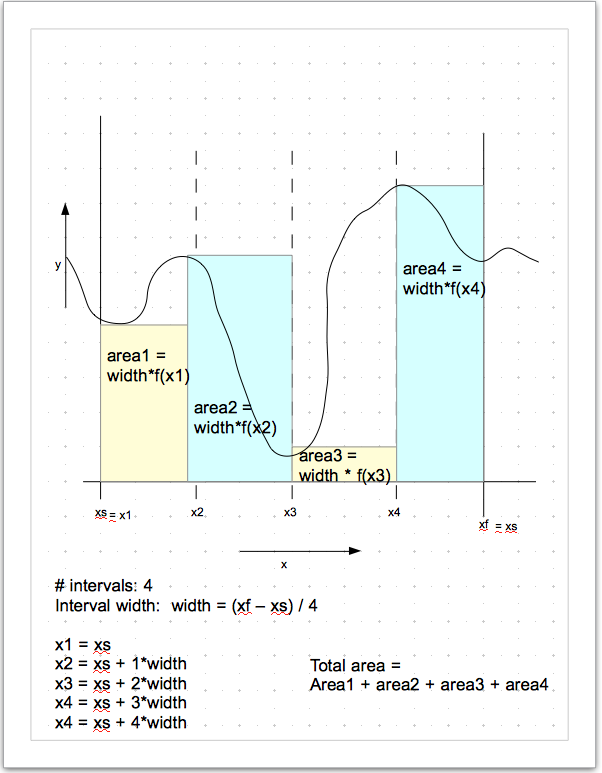
The fourth figure shows the range of x divided into four segments. There are now four rectangles. The estimated area under the curve is the sum of the areas of the four rectangles.
This fifth figure shows the range of x divided into eight segments.
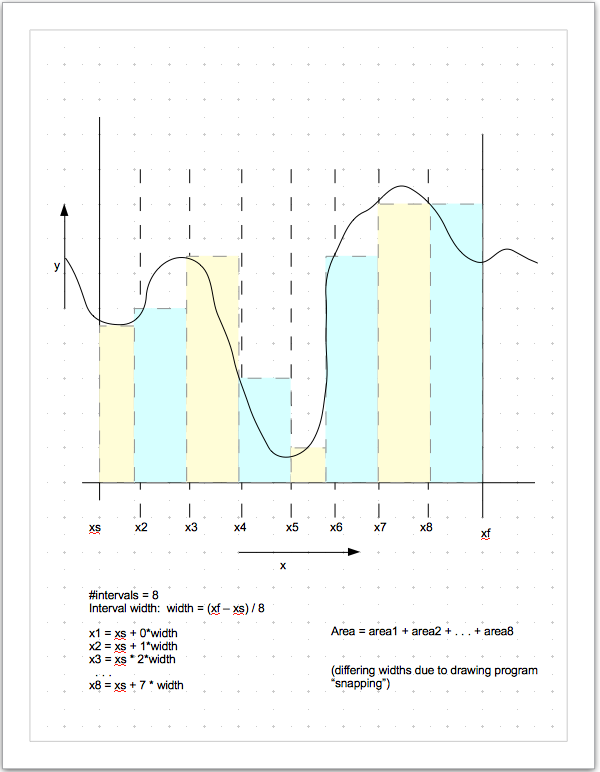
The purpose of this experiment is to show that as the number of rectangles (i.e., the number of intervals) increases, the total area approaches the true area under the curve. The true area can be analytically computed by integrating the curve.
In your project, you should choose an appropriate set of interval widths that will demonstrate that numerical integration "works". 200 segments is not too many.